-
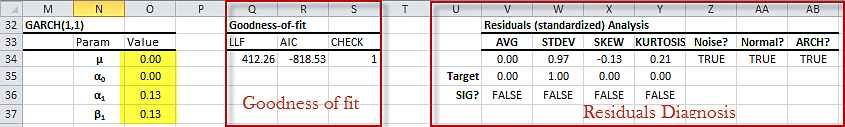
GARCH(1,1) Model table
The GARCH(1,1) model output table generated by NumXL GARCH wizard for the S&P 500 ETF log monthly returns time series.
-
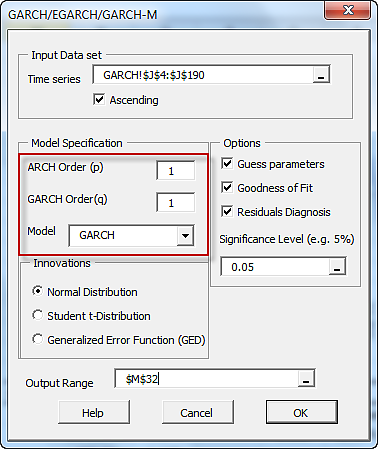
NumXL ARCH/GARCH Wizard
In the NumXL GARCH model wizard, enter the orders of the ARCH and the GARCH components. Leave Model selection to as GARCH
-
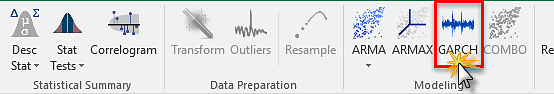
Selecting GARCH Wizard in NumXL Tab
Locate the GARCH icon in NumXL Toolbar (aka Tab), and click it to invoke the ARCH/GARCH Wizard.
-

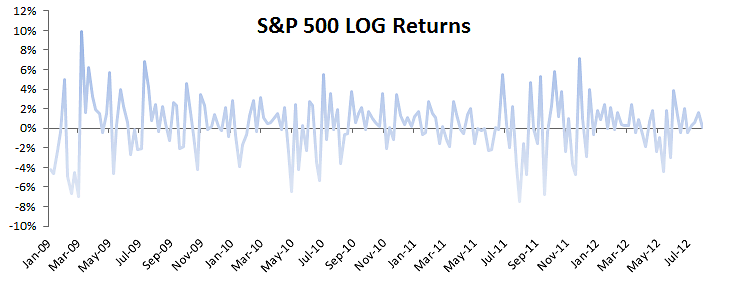
Plot for S&P 500 monthly log returns
A plot for the S&P 500 ETF log monthly returns between Jan 2009 and July 2012
-
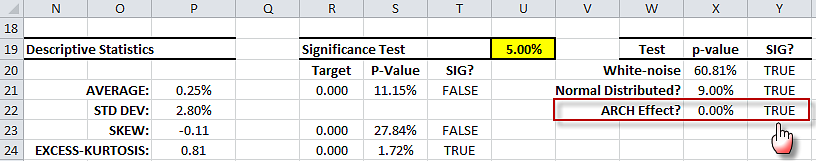
The summary statistics table showing ARCH effect test
ARCH Effect test results for S&P 500 monthly log returns
-
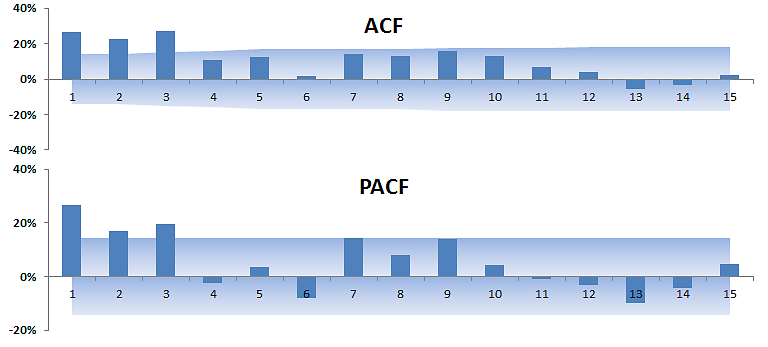
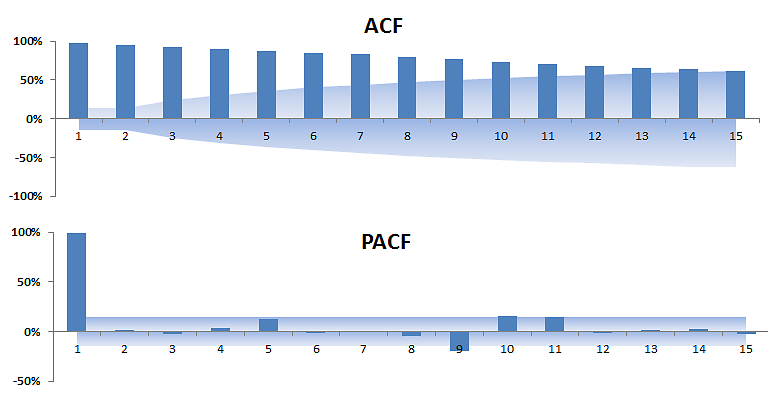
Correlogram plot for S&P 500 squared log monthly returns
Correlogram or ACF and PACF plot for the S&P 500 squared log monthly returns
-
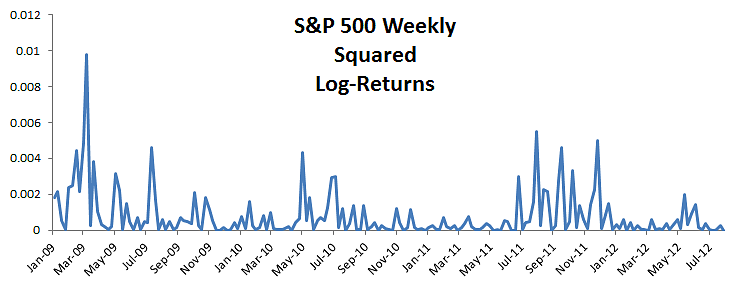
Plot for the S&P 500 squared monthly log returns.
Plot for the S&P 500 squared monthly log returns.
-
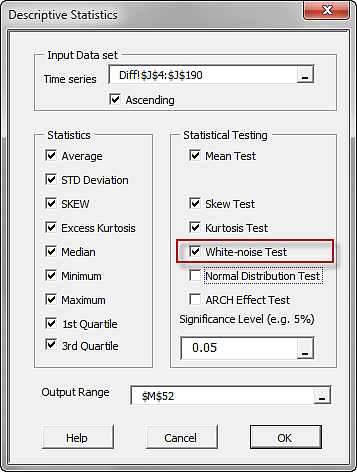
Select white-noise test in NumXL Descriptive Statistics wizard.
selecting a white-noise test in NumXL descriptive statistics wizard or dialog box.
-
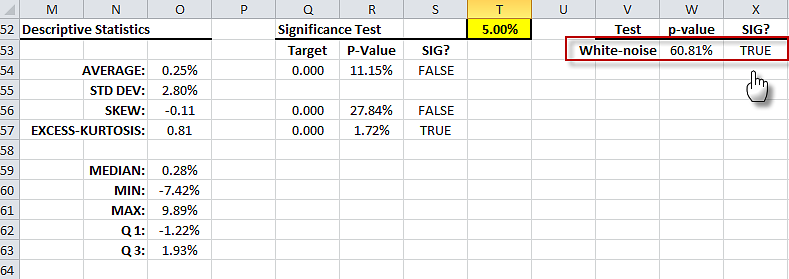
Summary Statistics table for S&P 500 monthly log return
Summary Statistics output table for S&P 500 monthly log returns with highlighted white-noise test.
-
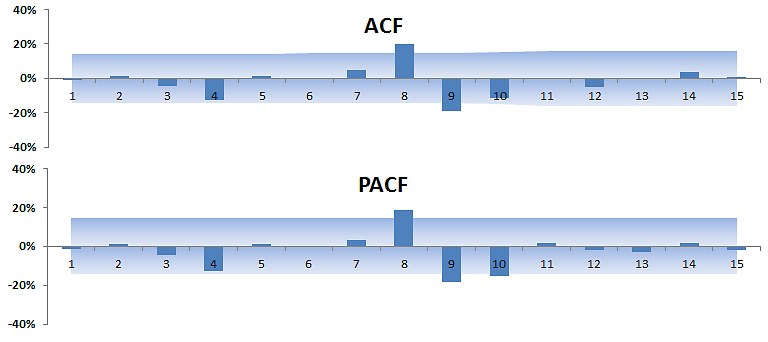
Correlogram plot for S&P 500 monthly log returns
The Correlogram or ACF & PACF plot for S&P 500 monthly log returns. (Generated by NumXL correlogram wizard)
-
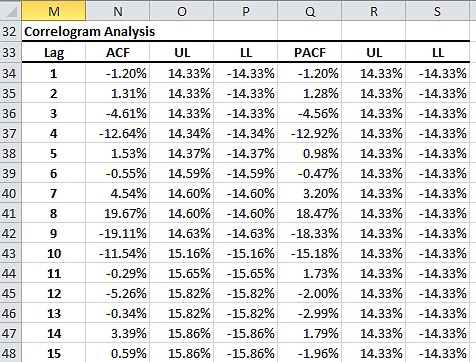
Correlogram table for S&P 500 monthly log returns
Correlogram output table for the S&P 500 monthly log returns.
-
Plot for S&P 500 monthly log return
Plot for S&P 500 ETF monthly log returns
-
Correlogram plot for S&P500 monthly prices
The autocorrelation (ACF) and PACF plot for the S&P 500 log monthly prices
-
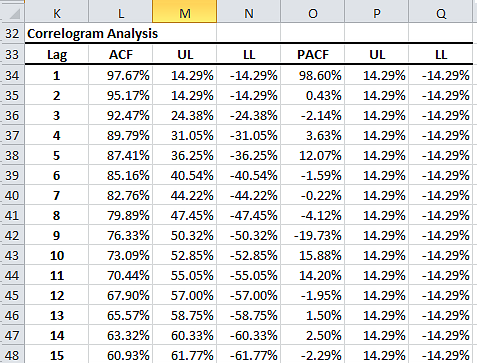
Correlogram output table for &P 500 log monthly prices
The autocorrelation (ACF) and PACF table for the S&P 500 log monthly prices
-
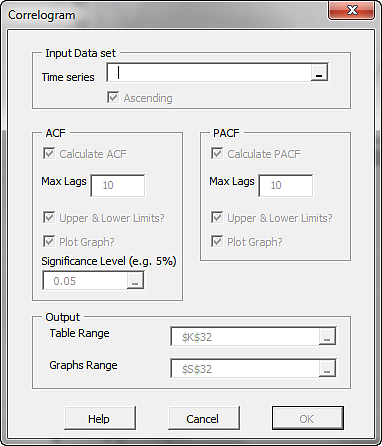
NumXL Correlogram Wizard
NumXL Correlogram Wizard or dialog box
-
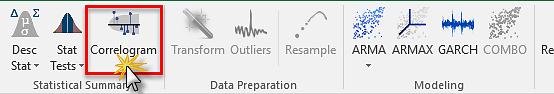
Correlogram icon in NumXL Tab
NumXL toolbar with correlogram icon selected
-
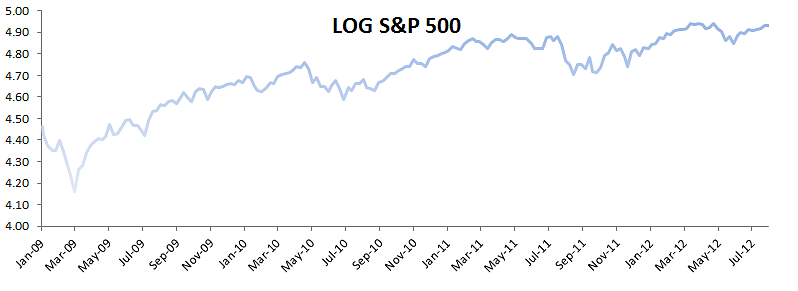
SPDR log-prices
a plot for daily log prices of S&P 500 ETF between Jan 2009, and July 2012
-
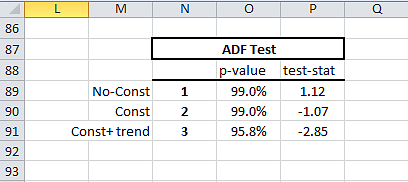
sp500-price-adftest-tbl.png
Augmented Dickey-Fuller (ADF) test for stationarity. The table is generated using the NumXL ADF Wizard fo r different stationary s…
-
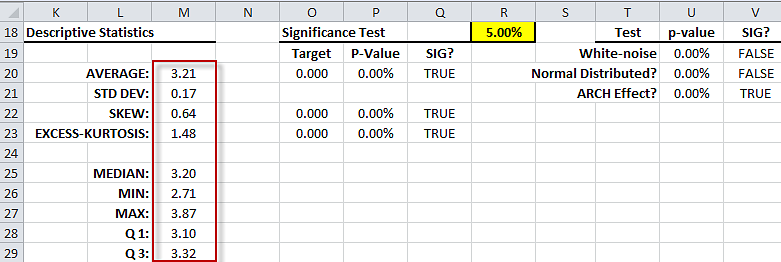
descstat-summary-tbl.png
Output table generated by descriptive statistics wizard using the daily log-price for Microsoft stock between Jan, 2000 and Jan 20…
-
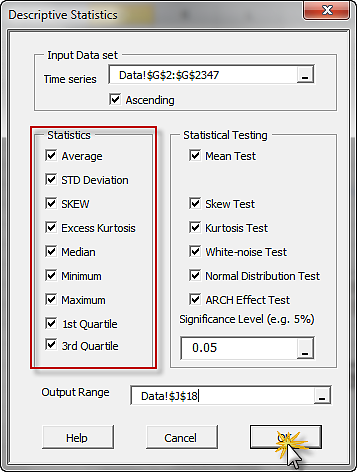
descstat-statistics-dlg.png
Descriptive Statistics Dialog or Wizard. Select the cells range for your input data, and select the different stats available (on…
-
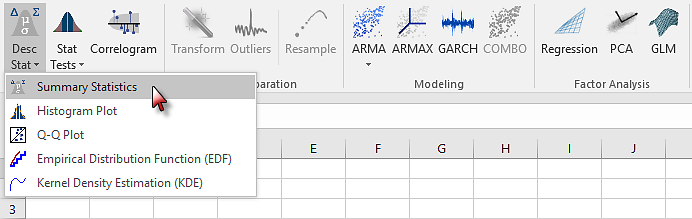
Selecting descriptive statistics icon in the NumXL 2007/2010 toolbar
Invoking the summary statistics wizard in NumXL 1.63 Toolbar