-
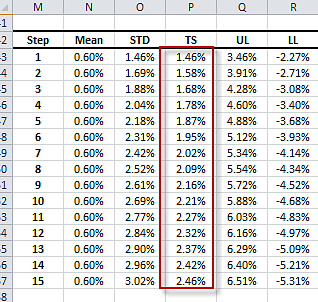
GARCH(1,1) Forecast table showing term structure volatility
In this GARCH(1,1) forecast table (generated by NumXL Forecast wizard), the volatility term structure forecast are shown in the re…
-
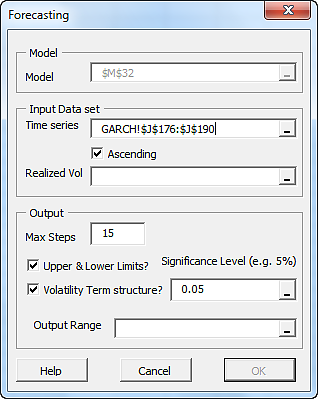
NumXL forecast wizard/dialog
The NumXL Forecast wizard/dialog pops up. The model reference cell is already selected and grayed out in the dialog.
-
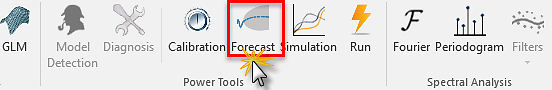
Selecting forecast icon in NumXL toolbar
After you select the top cell in GARCH(1,1) Model table, locate the forecast icon in NumXL toolbar (aka Tab), and click it to Invo…
-
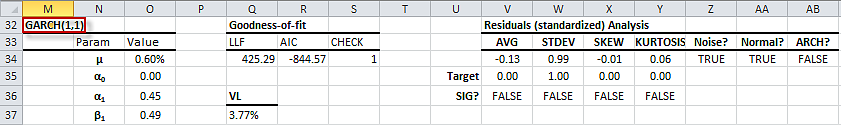
Calibrate GARCH(1,1) model table
After we calibrate the GARCH(1,1) model, and verified its assumptions by examining the residuals, we are ready to use it for forec…
-
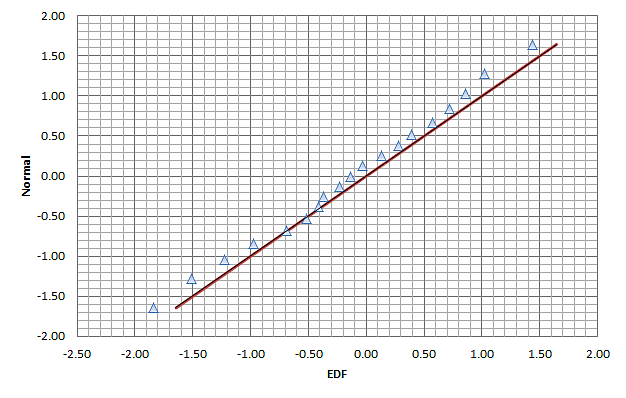
QQ-Plot for GARCH(1,1) standardized residuals
A QQ Plot for the standardized residuals of the calibrated GARCH(1,1) model.
-
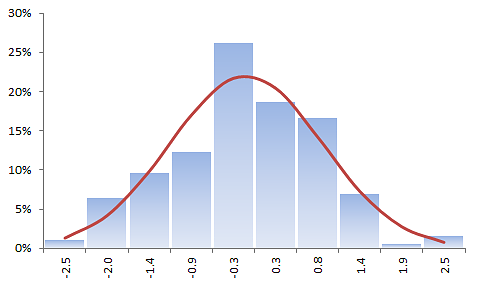
Histogram plot for RCH(1,1) standardized residuals
A histogram plot for the standardized residuals of the calibrated GARCH(1,1) model with an overlay Gaussian distribution curve.
-
Residuals Diagnosis -Examine the serial correlations in the residuals
In the residuals diagnosis table, we perform a statistical test for the presence of inter dependency(aka serial correlation) in th…
-
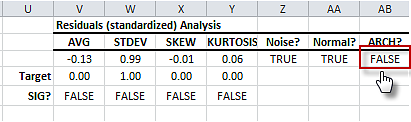
Residuals Diagnosis -Examine the ARCH effect in the residuals
In the residuals diagnosis table, we perform a statistical test for the ARCH Effect (i.e. presence of inter dependency(aka serial…
-
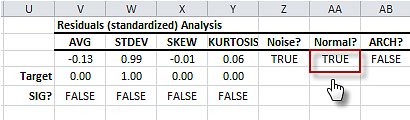
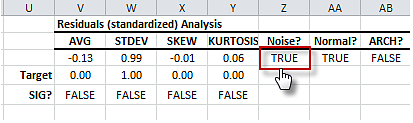
Residuals Diagnosis -Examine the normality distribution of the residuals
In the residuals diagnosis table, we perform a statistical test for the normal distribution assumption of the of the standardized…
-
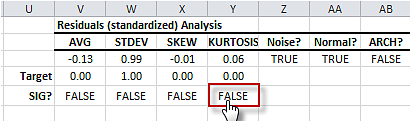
Residuals Diagnosis -Examine the sexcess kurtosis of the residuals
In the residuals diagnosis table, we perform a statistical test for the significance of the standardized residuals excess-kurto…
-
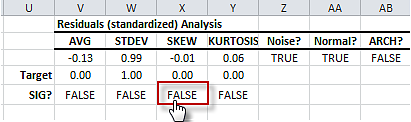
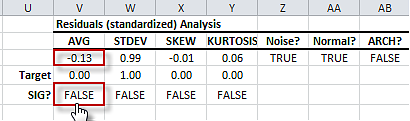
Residuals Diagnosis -Examine the skewness of the residuals
In the residuals diagnosis table, we perform a statistical test for the significance of the standardized residuals distribution…
-
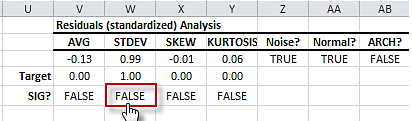
Residuals Diagnosis - Testing for standard deviation(i.e. sigma)
In the residuals diagnosis table, we perform a statistical test for the significance of the standardized residuals standard dev…
-
Residuals Diagnosis -Examine the mean of the residuals
In the residuals diagnosis table, we perform a statistical test for the significance of the standardized residuals mean against…
-
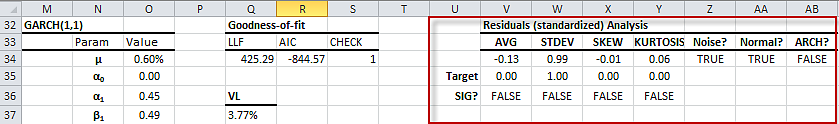
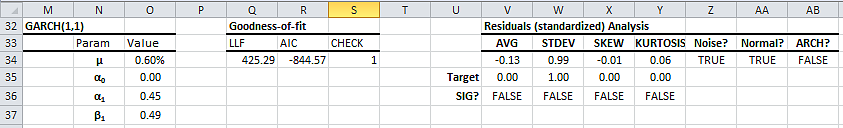
Residuals diagnosis section in GARCH Model table
In the generated GARCH model table, the rightmost section contains tests and check for the standardized residuals to verify the un…
-
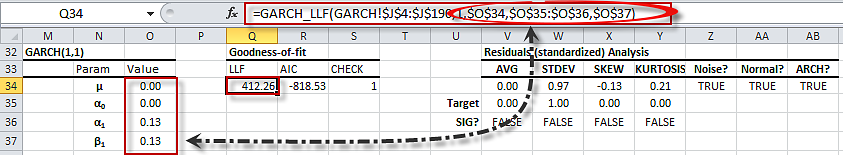
GARCH(1,1) Model table with calibrated values
Upon solver successful completion, the optimal values of the GARCH(1,1) model are inserted in the table, and calculation referenci…
-
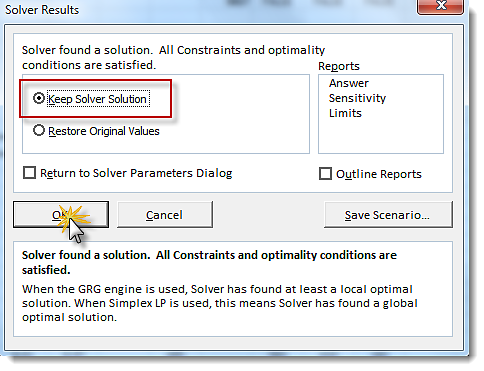
Excel Solver Found a Solution for GARCH(1,1) calibration
Excel Solver found a solution for the calibration problem of the GARCH Model
-
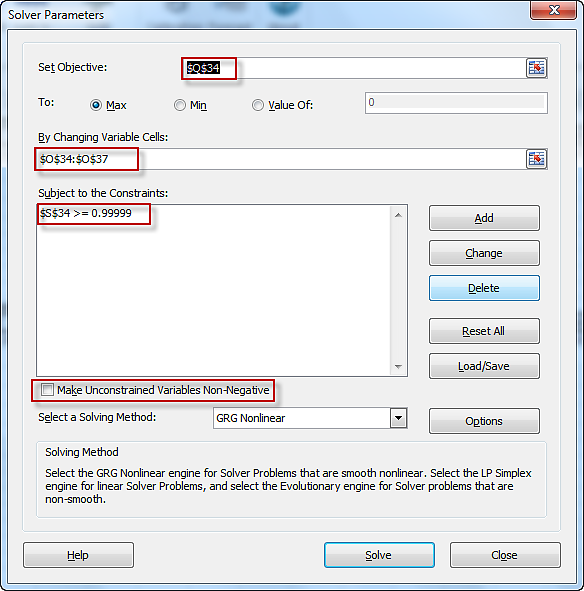
Excel Solver with GARCH(1,1) model calibration settings
NumXL launch Excel Solver with its fields initialized with model's cells: parameters, utility function (i.e. LLF) and the constrai…
-
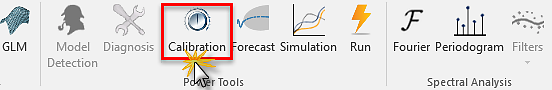
Selecting the calibration icon in NumXL toolbar
Select the header cell of the model table, Locate the calibration icon in NumXL Toolbar (aka Tab), in the Power Tools section, and…
-
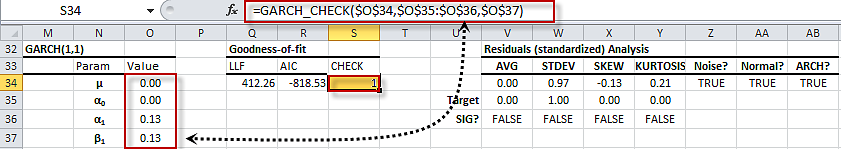
GARCH(1,1) - Model stability check
In the middle part of GARCH(1,1) model table (aka Goodness of fit), note the formula under the CHECK. The function GARCH_CHECK ref…
-
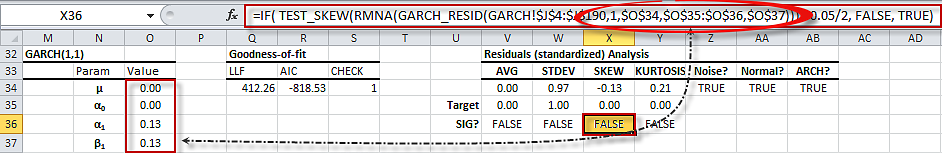
Generated Formulas in the Residual Diagnosis section of GARCH model table.
The Residuals diagnosis section of GARCH(1,1) model table is dynamic; note the generated formula references the input cells range…
-
Generated formulas in the GARCH(1,1) model table
The generated GARCH(1,1) model table is dynamic; note that cells are populated with formulas the references model's parameters cel…